Showing posts with label De-carbonising Industry. Show all posts

Sunday, February 20, 2022

De-Carbonising The Industrial Sector - Carbon Capture - Part D

Carbon Capture & Storage (CCS) is an integral part of the decarbonisation story but this strategy has not been well understood or publicised till date. CCS has also been grossly underfunded in the past decade as compared to solar or wind power generation or electric vehicles. Per some estimates, solar power has attracted annual investments of around US$ 80 -120 billion or more per annum in the last decade - CCS on the other hand has been struggling to secure capital (<US$ 5 billion per annum). 

Understanding the big picture

Before we jump into what CCS is, what its challenges are and its applications, it would be advisable to take one step back and appreciate a fundamental concept of decarbonisation. 

To achieve decarbonisation or net zero society there are two fundamental approaches. In common nomenclature the two are expressed as (a) conservation or prevention techniques (b) sequestration or capture techniques. 

Solar or Wind generation are good examples of conservation techniques. With conservation or prevention techniques, power is generated from wind or solar assets without the emission of CO2 or GHGs. This is one critical technique towards de-carbonization. On the other hand, there are sequestration or capture techniques that attempt to capture the CO2 being emitted into the atmosphere. 

The world needs both prevention AND capture to achieve net zero. There is no path that suggests one technique can be used exclusively. Both have vital roles to play. 

Conservation techniques especially in power generation are competitive on $/ton of carbon basis largely due to the fall in solar and wind generation costs. The cost of carbon is calculated by swapping solar for coal fired generation, determining the cost of swapping coal to solar and working out how much CO2 has been saved over the life of the assets after the swap. For wind and solar, the costs to switch are negligible and at times even negative (cash accretive to swap coal to solar). 

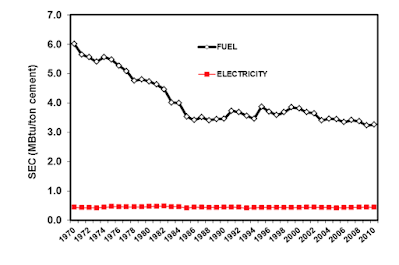
However,  conservation costs ($/CO2) rise sharply for sectors that are hard to abate such as CO2 emissions from cement, airlines, shipping etc. The alternatives to prevent CO2 generation for these sectors is very expensive. There is where sequestration comes in. 

Sequestration has three buckets. (A) Natural sinks - forests are prime examples. Plants and trees use CO2 from the atmosphere as part of photosynthesis and emit oxygen (B) CCS which we shall evaluate in more detail (C) DAC or direct air capture. Similar to CCS but unlike CCS which is associated with a particular emitter of CO2 (e.g. coal fired plant), DAC is about capturing CO2 from the air directly. 

Sequestration as a technique may not be competitive where coal fired generation can be swapped for solar. However, as we move into reducing CO2 emissions from industry (e.g. cement) or harder to abate sectors like airlines, sequestration could be more competitive than conservation. 

Summary

To understand the full picture around decarbonisation always consider both conservation (reduces or eliminates CO2 emissions) and sequestration (captures CO2 emitted). These two approaches have different applications across the CO2 emitting world and are best used as complimentary techniques rather than competing ones.  

The graph below gives you a very good sense how the two techniques interplay. Also note the tighter range of cost uncertainty around conservation techniques as compared to sequestration. 


CCS - Carbon Capture (Step 1)

The first step in CCS is capturing carbon. Capturing CO2 from industrial plants and power stations has been ongoing and is not a brand new technique. The challenge this decade is to expand and scale up its applications across the world beyond natural gas processing plants and power generation. 

Two principal methods to capture CO2 are (a) physical separation (b) chemical absorption. There are other techniques as well which are evolving like the use of membranes. 

Chemical absorption uses solvents. Solvents absorb the CO2 from the flue gas (CO2 emitting stream) column. The solvent is then heated at high temperature in another column to release the CO2 and the solvent can then be re-used. A relatively mature technique, has been used in power plants in the US, steel projects, waste to energy facilities. Physical absorption is based on absorption or adsorption. Adsorption takes place via a solid like activated carbon. Absorption on the other hand takes place via a liquid surface like solvents. After the CO2 has been captured, it is released separately via heat, pressure or vacuum. Physical separation has been used in natural gas processing plants, ethanol, methanol production facilities and is mostly used in the US. 

The appropriate technique used to capture CO2 depends on:

- Initial CO2 concentration: the higher the CO2 concentration, the easier to capture and more cost effective

- Final desired CO2 emission levels: as the target capture rates are higher naturally the cost increases 

- Temperature and pressure requirements and availability 

- Cost considerations : one of the key cost consideration is CO2 concentration levels. If the CO2 levels are high to begin with then it becomes economical and cost effective of a $ per CO2 captured basis. Thats why CCS has mostly been used in natural gas processing plants as of now where CO2 concentration is very high. It also explains why direct air capture (DAC) of CO2 from the air is so expensive as CO2 concentration in the air is very low. The graph below shows the cost of CO2 capture as depicted by IEA. 

That is why CCS is actively used in gas processing plants or ethanol production. Look at the $/ton cost to capture CO2 directly from the air in comparison.  


- flow rates of flue gas that contains the CO2 and finally 

- integration of the CCS with the source of emissions 

CCS - CO2 transport (Step 2)

Transport is the next step after capturing CO2. The captured CO2 needs to be transported to a safe and secure location for long term storage. Without transport CCS fails. The prime mode of transporting CO2 is pipelines although ships, trains and trucks can also be considered. As of now the cheapest mode remains pipelines especially when final storage location is onshore. North America where CCS is most common, benefits from the extensive pipeline network that exists for transporting CO2. 

Transport costs can be around 25% of the total cost. The cost depends a lot on how much CO2 is to be transported, the distance, size of the pipelines, pressure & moisture content requirements. The cheapest of course is to repurpose existing oil & gas pipelines subject to HSE parameters. If the final storage location is an offshore structure then transport cost goes much higher. Offshore adds considerable complexities to CCS operations and ships might have to be used in place of pipelines if distances are too great. 

The U in CCS? (Step 3)

Sometimes CCS is referred to as CCUS. The U stands for utilisation, i.e. utilisation of CO2 that has been captured and transported. Around 230-250 million tons of CO2 is used by industry today (world emits around 35 billion tons of CO2 per annum). The two primary applications of CO2 are (i) manufacture of Urea where CO2 is used as a feedstock (ii) Enhanced Oil Recovery (EOR) 

[https://en.wikipedia.org/wiki/Enhanced_oil_recovery#:~:text=Enhanced%20oil%20recovery%20(abbreviated%20EOR,using%20primary%20and%20secondary%20recovery.]  

where CO2 is injected into existing oil & gas production sites to enhance the recovery of hydrocarbons. 

The other potential applications for CO2 in the future could include synthetic fuels like methanol, production of chemicals and use of CO2 in building materials. All these are relatively untried and untested and it would be hard to provide an estimate on the usage potential for CO2 in these applications. 

Use of CO2 is a vital factor from a cost perspective. If the captured CO2 finds a use then the cost of CCS drops. However, usage of CO2 needs to be carefully considered. Otherwise it may result in captured CO2 being returned back to the atmosphere thus defeating the purpose of CCS. To this effect EOR and the building materials sector are attractive as CO2 remains captured for a very long time. Use of CO2 as a synthetic fuel much less so as the captured CO2 gets released back upon combustion of the synthetic fuel. 

CCS - Storage - (Step 3)

After CO2 is captured and transported comes the final stage which is CO2 must be stored securely to prevent CO2 being released back into the atmosphere. We did discuss some uses of CO2 earlier. If there is a use for the captured CO2 then its great but if not it must be stored. 

Storage involves injecting the CO2 into deep underground formations that meet the stated requirements of a porous rock where the CO2 can be housed and a impermeable layer of rock which provides the seal to prevent the CO2 from escaping. The two most preferred formations are (i) saline formations - porous rock with saline water acting as a seal and (ii) depleted oil & gas reservoirs as they previously have stored hydrocarbons in a porous rock with an impermeable rock layer on top. Gas reservoirs (low CO2 reservoirs) are especially preferred.  As EOR is now fairly common, storing CO2 in depleted fields is well established and proven. 

Storage sites are not expected to be the constraint for CCS. As per the IEA, storage capacity as of today ranges between 8,000 giga tons to 55,000 giga tons. Geographically North America, Russia and Africa have the highest storage potential. Onshore storage will be preferred to offshore as the costs to transport and store is much lower. To set the storage capacity in perspective, the IEA estimates the lowest bound of storage capacity is 8,000 giga tons whereas the total cumulative CO2 capture via CCS from 2020 to 2070 is 220 giga tons under IEA's decarbonisation / net zero scenario.

Risk of leakage of CO2 has been playing on the minds of many CCS skpetics. However, there is a long history of injecting and storing CO2 safely and securely. 

From a cost perspective, the cost of storing CO2 is much lower than capturing or transporting CO2. Cost of storage is based on methods of injections, location of the site and storage characteristics. If CO2 is being used for EOR purposes then costs can be offset via higher production of hydrocarbons. Onshore storage in the US could be below $10/ton of CO2 stored for nearly 60% of the sites. 

CCS Challenges

CCS has faced underinvestment in the past decade. CCS projects received very little funding hence the technology remained sub scale as compared to solar or wind power generation. A section of environmentalists have attacked CCS since it does not prevent the use of hydrocarbons but focusses on capturing CO2 hence does not encourage a pivot away from hydrocarbons. As CO2 gets used as EOR projects, the complaint is using CO2 for EOR results in more hydrocarbon recovery thus the solution is facilitating more hydrocarbon usage. 

Capturing CO2, i.e. step 1 is the hardest and costliest. CO2 capture needs energy which adds to costs and CO2 being emitted in the process. Transporting CO2 is not easy and may require new pipelines or re-tooling existing ones.

Despite these challenges, CCS is expected to become front and centre of decarbonisation strategies this coming decade. In part E we shall look at the trends and changes to CCS that are expected to impact it this coming decade.  

Monday, December 27, 2021

De-Carbonising The Industrial Sector - Part C - Cement Industry

Overview of Cement & Concrete 

Cement is one of the key ingredients for making concrete. Concrete is composed of 10% cement, 20% air / water, 30% sand and 40% gravel. This is an important distinction to make, notably that cement is just one of the ingredients of concrete but a vital ingredient. 

Concrete is abundantly used in the world and arguably the most abundantly used man made material on the planet. Concrete has been in use for a long time and the Romans have used concrete in their structures although modern concrete production methods differ from antiquity methods. 

Modern cement manufacturing commenced in 1824 and is called Portland Cement which is still the predominant approach to cement manufacturing. Whilst western nations used concrete extensively in the 20th century, China since the turn of the millennium has used more concrete than what the US poured in the entire 20th century. This shows the integral nature and importance of concrete when it comes to our modern societies and development. 

Concrete is preferred for under water construction projects. This is because concrete is both fire and water resistant which is one of the key appealing features of concrete. Concrete is used extensively for both residential and commercial construction, infrastructure projects, bridges, roads, dams etc. Concrete has very high compressive strength as well. The largest concrete structure in the world is located in China, the 3 gorges dam which is 185 metres high and 2300 metres long! 

Cement Production Snapshot

In 1970, world cement production stood at 594 million tons. By the year 2020, world cement production stood at 4.1 billion tons! Compare the growth of cement with steel which we analysed in part B. Steel grew from 595 million tons in 1970 to 1.8 billion tons by 2020. This shows whilst steel has been growing at an immensely fast rate, cement has out stripped steel. In fact cement production has been above 4 billion tons per annum since 2014. 


Source: Statista

Again China is the dominant cement producing nation having produced nearly 2.2 billion tons of cement (source statista) in 2020 which means 50% of world cement production is based in China. Unlike steel or petrochemicals, both which are extensively traded, cement is hardly traded and is consumed in the country of production itself. After China, the next biggest cement producer is India standing at around 340 million tons. 


Source: statista 

Cement projections by the IEA hold cement production above the 4 billion per annum mark into 2030 and even into 2050. This is because countries are still increasingly consuming cement to develop infrastructure, roads, buildings etc. The integral nature of cement ensures that cement production is unlikely to sharply taper of in the future.   

In the business as usual case the IEA projects that cement production will trend towards the 5 billion tons per annum mark. However, in a more balanced scenario (Sustainable Development Scenario) because of material efficiency gains, cement production will fall by 2070 to around 3.5 billion tons. Material efficiency can come about by extending the lives of buildings, repair rather than rebuilding, onsite waste reduction and design optimisation.

Already developed countries are seeing cement demand flat to falling as most of the demand is for maintenance rather than new builds. There is also a degree of saturation being observed in China with respect to cement demand. However, this will be counter balanced by India and other emerging economies are expected to increase their demand for cement in the future.  

Cement - Energy consumption and CO2 emissions

Cement production is highly energy intensive. Around 2.8 GJ of energy is needed to produce 1 ton of cement which translates into around 10.7 exajoules per annum of energy consumption for the industry. Energy costs account for around 15% to 40% of total product costs as per the IEA. Coal is the dominant energy source for the industry and fossil fuel provides around 60%-70% of the total energy needs for cement production. 

On the emissions front producing 1 ton of cement generates 0.5-0.6 tons of CO2. Compare this is to steel via the blast furnace route which will produce nearly 2 tons of CO2. Hence, cement is not as CO2  intensive as steel but is still quite intensive. In 2019, the cement industry worldwide emitted 2.4 billion tons of CO2 which meant cement contributed to around 7% of global CO2 emissions. 

Importantly, nearly two thirds of the emissions from the cement industry are process emissions which is a stark contrast to the steel industry where bulk of the emissions result from fuel combustion.  

Cement Production Method 

Unlike steel where there are quite a few methods of production, for Portland Cement it is essentially one and has remained unchanged for around 200 years or so. Limestone (CaCO3) is the prime feedstock for cement. Limestone is heated to around 1500C to 2000C in a rotary kiln in the presence of other additives like quartz, clay etc. Simplistically, CaCO3 under the application of heat becomes CaO (clinker) and CO2. 

This shows that CO2 emissions are fundamentally linked to the production process of cement itself and is a very important concept to remember. 

Clinker is then mixed with gypsum to form cement. 

The videos below show how cement is made. 

https://www.cement.org/cement-concrete/how-cement-is-made

https://www.youtube.com/watch?v=TdxPxfeEUSQ

Cement is then mixed with water/air, sand and gravel to form concrete which is the final building block material. There is a link below to more details around the production of concrete from cement. 

https://www.cement.org/cement-concrete/how-concrete-is-made

Cement production challenges

1. Process emissions : around two thirds of the CO2 emissions from cement manufacturing comes from the process itself. Application of heat to lime to produce clinker results in CO2 emissions. Unless there are alternative materials to clinker, CO2 emissions will continue to take place during the production of cement. 

2. Fossil fuel for combustion: cement kilns need to be heated to 1500C -2000C. Fossil fuel is primarily used for this purpose and within the fossil fuel category it is coal that dominates usage in the cement industry (50% or so). Given the high temperature requirements for the process and kiln design, fuel switching or electrification is not a very easy option.

3. Regional industry: unlike steel and chemicals which are global industries whose products are shipped across the world, cement is a very regional industry. Cement plants are established close to raw material centres or end user demand centres. This implies that cement plants will tend to use more locally available energy sources rather than the most environmentally friendly options. Also given the product is not traded over long distances and there is no ready substitute product for cement provides little incentive to the manufacturers to change their fuel mix or consider carbon capture technologies.

4. Age of asset life - cement plants have an average life of around 40 years since commissioning. Most of the cement capacity in the recent past has been added in the Asia Pac region and the average age of these plants is below 15 years. With high capex costs needed to establish new cement kilns, it is not possible to prematurely retire existing plants and replace them with new cement plants that emit low CO2. Therefore retrofitting existing cement plants is critical.


source IEA. 

5. Indispensable nature of the industry: there are very limited / no alternatives to cement at the moment. Consumption of cement & concrete has only been rising. As countries continue to urbanise and invest in infrastructure and buildings, demand for cement will continue. Cement being largely water and fire proof as a material also makes it very attractive. In addition, the building block for cement is limestone which is abundantly available, making it a preferable choice for all countries.   

Route to decarbonisation 

The route to decarbonisation for the cement industry must start with appreciating the key fact that two thirds of the cement sector's emissions are process emissions. 

There are two key strategies needed in addition to the material efficiency already discussed in the section around Cement Production Snapshot.

A. Clinker to Cement Ratio : there needs to be a fall in the clinker to cement ratio. By reducing clinker and increasing other less CO2 intensive additives into cement the overall CO2 intensity of cement will reduce. Substitutes for clinker include fly ash (from coal fired power plants) or slag (steel production). However, both these two should also decrease as we speed up decarbonisation in general. Other naturally occurring substances that could be used include clay, gypsum, limestone. 

Clinker to cement ratio however has been inching up and reached 72% in 2020 as per the IEA. In IEA's net zero 2050 scenario, clinker to cement ratio must fall to 0.65 by 2030. There are limitations here with respect to how much adjustments can be made to this ratio as cement composition is a highly regulated and safety considerations are paramount. Further, China the world's largest cement manufacturing nation has one of the lowest clinker to cement ratios already. 

B. Carbon Capture Utilisation and Storage (CCUS) : This is the key carbon reducing solution that is prescribed for the cement industry. This is projected to account for nearly 60% of the reduction of cumulative emissions of the cement industry. Note since process emissions are key in cement, carbon capture takes a pivotal slot. CCUS uptake will increase after 2030 by which the hope is for CCUS costs to fall considerably. The IEA projects nearly one cement plant per week of 2 mtpa capacity being fitted or retrofitted with CCUS from 2030 to 2070 and cumulative CO2 capture target of 40 billion tons!  

Other considerations include:

Technological improvements : Expected to be limited as the two main cement producing regions China and India already employ dry kilns with a pre calciner which is the most updated cement producing technology. Energy intensity in the cement industry as shown in the graph below has already been falling over the past few decades hence greater improvements in this regard could be minimal. 


Fuel Switching: The prime fuel for the cement industry is coal. A switch to a lower CO2 intensive fuel such as natural gas, bio fuels and hydrogen is a possibility to reduce CO2 emissions. As temperature requirements for a kiln are high, the ability to switch to electricity is very limited. Given CCUS is the prime strategy to reduce CO2 emissions, more gains can be made by switching from coal to natural gas than say bio fuels as bio fuel sourcing is already constrained in the global system. 

Hydrogen:  Hydrogen use is likely to be limited in the cement industry's transition. This is because considerable capex has to be spent to reconfigure a kiln if hydrogen as a fuel is used. Hydrogen is more likely to be used as a blend along with natural gas rather than 100% standalone hydrogen. Hydrogen requires cement burners etc to be re-designed and new coatings to be applied inside kilns etc which makes it very expensive

In the IEA net zero scenario for cement, coal use is eliminated completely by 2050. Natural gas replaces coal with a energy share of 40% (up from its current 15%), biomass and renewables at 35% (up from its current 5%), hydrogen, direct electrification, oil, others etc is the balance. Hydrogen would be around 10% of the thermal energy by 2040. 

Recent Initiatives in Decarbonising Cement 

As CCUS is the key technology to decarbonise cement manufacturing, lets look at a few projects (links to relevant videos are provided for additional context) currently ongoing that might prove critical and positive towards decarbonising cement. 

Anuhi Conch Cement is the largest cement company in China and has a clinker production capacity of 260 million tons. Anuhi has invested around $10mm in a CCUS facility for one of its plants that will separate and purify 50,000 tons of CO2 per annum. 

Norcem the Norwegian cement manufacturer is also looking at a CCUS project. It has successfully completed a feasibility study, and is now looking to scale it up to industrial levels.  https://www.youtube.com/watch?v=1dv38NhUyoE

Pilot scale project has been successfully completed by CEMCAP in Germany for carbon capture. https://www.youtube.com/watch?v=QSmEJgVKz-A


Sunday, December 26, 2021

De-Carbonising The Industrial Sector - Part B - Iron & Steel Sector

Overview of steel

Steel is a fundamental building block for today's modern societies. Steel is used in a variety of applications ranging from transportation (cars, ships, rail, planes), energy generation (wind & solar installations but also conventional energy generation sources), construction of buildings & infrastructure projects, appliances etc. Nearly 68% of a car is composed of steel and more than 80% of a wind turbine's components are steel for example (source: Arcelor Mittal).  

Steel has very high tensile strength, it is malleable, ductile and since it is manufactured, it can be made to a very standardised quality unlike naturally sourced wood. Steel is durable, can be made rust / corrosion proof, is long lasting, can withstand external forces and is light weight. Steel used in construction is extremely efficient as most steel structures can be prefabricated making construction faster, cheaper and safer. Steel is significantly more fire resistant than wood but less so than concrete. Most importantly, steel is 100% recyclable. 

[Paper produced by world steel on the applications and use of steel. A good read in a crisp and informative format.] 

https://www.worldsteel.org/en/dam/jcr:4864507f-7f52-446b-98d6-f0ac19da8c6d/Fact%2520sheet%2520steel%2520applications%25202021.pdf

The importance of steel can be demonstrated by looking back at the growth of world crude steel production. It would make sense to compare steel production growth (source world steel) versus population growth to see how much we are now consuming and why steel is popular and will continue to remain so. 

As the table shows, steel production has outstripped population growth hence we are consuming more steel per capita now than in the past. 


Population (billion)

World Crude Steel Production (mm tons)

1970

3.682

595

1980

4.43

716

1990

5.28

770

2000

6.11

848

2010

6.92

1435

2020

7.75

1878

Multiplier

2.1X

3.15X


Source: World Steel 


Steel production and consumption is unlikely to abate from its 2020 production level of c. 1.87 billion tons. As per the IEA, in 2019 an average of 240kg of steel was produced per annum per person and this is expected to rise to 260-270 kg per person per annum in the future (STEPS projection scenario) which implies we could be seeing world steel production just shy of 3 billion tons per annum by 2070. In a more environmentally conservative scenario, the IEA projects steel demand to be flattish till 2070 on the back of material efficiency gains. A large part of this future demand could be fulfilled through the recycling of the steel. 

Steel production is highly concentrated in the Asia Pacific region with China accounting for more than 50% of global production with Chinese production in excess of 1 billion tons. China is followed by India at around 100 mm tons followed by Japan at around 88 mm tons. 5 of the top 10 steel manufacturing countries are located in Asia. - worldsteel report 2021. 

The largest steel manufacturing company in 2020 was the China Baowu Group which produced 115 million tons followed by Arcelor Mittal at 78 million tons. 

Source: World Steel


Steel Emissions and Energy Intensity 

Steel is one of the most highly emitting industries on record. Direct CO2 emissions from the steel industry in 2019 as per IEA was around 2.7 billion tons, a staggering number. Most of the emissions from steel are related to fuel / energy combustion versus process related emissions, a contrast to the cement industry. If one considers indirect emissions, then the industry is estimated to have emitted around 3.7 billion tons pa in 2019! 

Steel production is highly energy intensive and the industry is reported to have consumed around 26 exajoules of energy in 2019 and an estimated 15% of world coal demand comes directly from the steel industry. Coal consumption in steel is a significant cause for GHG emissions.   

Steel Production 

There are essentially three routes to produce steel (a) blast furnace, basic oxygen furnace [BF] (b) scrap based electric arc furnace [EAF] (c) direct reduction electric arc furnace [DRI]

In this note we shall review the three alternative approaches to manufacturing steel, their respective pros and cons, the energy consumption and emissions for each of these approaches. As argued in an earlier note, the production of steel is a major component of GHG emissions hence a deeper understanding of the steel industry is essential.

A quick comparison of the three methods across key parameters before we jump into details is provided in the table below. Source of data is IEA


CO2 emission / ton of steel 

Energy Consumed / ton of steel (GJ/ton)

% share of production 2020

% share of production 2050 - Stated Policies

BF/BOF

2.2

21.4

70%

52%

Scrap - EAF

0.3

2.1

22%

36%

Nat Gas / DRI

1.4

17.1

7%

11%

Iron & Iron Ore 

The key building block for virgin steel is iron which in turn is naturally found as iron ore. Hence, before we get into the manufacturing processes of steel, we should spend some time on iron. Iron is abundantly found on the earth's surface however, it rapidly oxidises and hence iron is naturally found as iron ore. Iron ore is the basic / fundamental material used to produce steel. 

As iron ore is naturally occurring, it can be found in varied sizes. The biggest can be c. 1 metre across and the smallest 1mm. Iron ore is therefore classified into fines, lumps and pellets. 

Iron ore can be

A. hematite (Fe2O3) red - 69.9% iron content, 

B. magnetite (Fe3O4) black - 72.4% iron content, 

C. limonite (2Fe2O3.3H2O) brown - 55% iron content and 

D. siderite (FeCO3) - 48.2% iron content and which is pale brown. 

Hematite and Magnetite are the two most commonly occurring forms of iron ore.

Now we come to the steel manufacturing process itself.   

Blast Furnace, Basic Oxygen Furnace [BF]

The BF route is currently the most dominant method of producing steel. Around 70% of steel manufacturing happens via the BF route and as shown in the table above, this process is highly energy intensive and emits significant CO2. The BF route is used to produce virgin steel as the steel produced via the BF route starts from naturally occurring iron ore.  

Three basic feeds for the BF are namely iron ore, coke (charcoal) and limestone plus hot air. The BF needs to be heated up significantly to around 2000C [such high heat requirement needs fossil fuel combustion]. 

Without getting into detailed chemistry, the objective is to split the iron from oxygen and carbon is used as a reducing agent in this respect. In many cases carbon is first turned to carbon monoxide CO to make it a more efficient reducing agent. The limestone on the other hand is used to react with the sand (comes along with the iron ore) to produce slag which comes out at the bottom of the furnace. Along with slag comes molten iron (iron largely free of oxygen) which is referred to as 'pig iron'. 

If you are keen to dig slightly deeper into the chemical equations then you can view this instructional video which I think does a pretty decent job in explaining the chemical equations

https://www.youtube.com/watch?v=UjBrZCNVt_s . 

Now its clear that two things are happening here which should result in GHG emissions. First high heat required to be produced by fossil fuel combustion, a major source of emissions. Secondly, as the above process shows, carbon / carbon monoxide act as reducing agents to produce pig iron but the by-product of this is carbon dioxide! 

The pig iron produced by the BF contains more carbon than optimally needed making pig iron brittle. To over come this, pig iron is further processed by heating pig iron along with some scrap steel and pure oxygen to eliminate carbon to produce crude steel. This second process also generates CO2 however, 80% or so of CO2 generated in steel making via the BF route occurs during the first stage itself. 

Scrap - EAF

This is a secondary method of producing steel as this method cannot use iron ore but instead requires scrap steel (recycled) for production. In this process, scrap steel is melted using electricity via graphite electrodes. Scrap steel is first sorted then heated and charged into an EAF along with lime. When an appropriate load of scrap steel is lowered into the EAF, the electrodes are lowered and an arc is generated to melt the steel. Additional chemical energy is added to the process via natural gas or oxygen. 

The primary disadvantage of this process is the need to source scrap steel and then sort the scrap steel before the EAF process commences. This process cannot use iron ore which is the naturally abundant form of iron. The biggest cost item for the EAF route is the cost of scrap steel. However, given steel is highly recyclable commodity, the use and importance of EAF is only growing. Further EAF use electricity rather than fossil fuel making it attractive route for decarbonisation of the industry.  

Around 70% of existing steel manufacturing in the US occurs via EAF. China on the other hand, the world's largest steel producer, is overwhelmingly BF approach right now (around 89%). 

Direct Reduction - EAF (DRI)

In this approach iron ore is reduced to pig iron in the solid state. This process requires higher quality iron ore as compared to the BF process. The degree of flexibility around iron ore quality is much less in the DRI process as pollutants in the iron ore cannot be removed in the solid state. The reduced iron is then melted into a liquid form in an EAF as a second step to produce crude steel. 

The key reducing agent in the BF route is carbon and carbon monoxide. In the DRI route, the reducing agent is a combination of hydrogen and carbon monoxide (syngas) which again leads to CO2 emissions but in lower quantum as compared to the BF route. 

The key feedstock used is natural gas to generate carbon monoxide and hydrogen (syngas) although in some countries coal is also used. As the iron ore descends from the top of the furnace in solid form, the syngas is fed from the bottom which reduces the iron ore to iron. The iron is then further processed in an EAF to produce steel. 

DRI is used when scrap steel availability is not enough to generate steel in quantity or when the demand needs are not sufficient to support a BF operation.   

For more information on DRI watch the following video by Midrex the leading DRI technology provider

https://www.youtube.com/watch?v=t8_yNvvs9bE

https://www.midrex.com/

The attached note below is from world steel dynamics and shows their view on the steel manufacturing processes as of 2019 and how the methods could evolve by 2050. 

https://www.aist.org/AIST/aist/AIST/Publications/wsd/WSD-February-2021.pdf

Impact of steel making on the environment 

The importance of steel is unquestionable as steel is being used by all countries across sectors. Steel has  become an integral backbone of modern societal development. However, as demonstrated above the production of steel is energy intensive, uses considerable fossil fuel and CO2 emissions take place intensely across fuel combustion as well as the process itself. At 2.6 billion tons per annum of direct emissions, the industry is without doubt a massive contributor to GHG emissions. 

There is no one path to decarbonise the steel industry and neither is there one specific technology that can be adopted. All plans rely on three critical pillars namely (a) improved efficiencies at site (b) greater recycling of steel and (c) break through technologies in the future. 

Improved Efficiencies 

Steel manufacturers around the world will continue to focus on improved efficiencies ahead of adopting breakthrough technologies of the future. Historically the steel industry has been working hard to enhance energy efficiencies and since the 60s energy intensity for steel making has dropped by 60%! As energy costs range between 20%-40% of total costs, energy efficiency is a key focus for the industry from a profitability perspective as well. 

In this phase, improvements will be secured around iron ore / scrap quality improvements, energy efficiency, process yields and process reliability. If this were to be successful, world steel believes that CO2 emissions will drop by 20% for BF / DRI routes (ore based) and by 50% for the EAF approach (scrap based). 

Greater Recycling 

Steel is a highly recyclable commodity and recycled steel is used in both EAF as well at the BF route albeit in different proportions; 100% for EAF. Current recycling rates stand at around 85% as per world steel estimates hence the ability to greatly improve via greater scrap collection percentage is limited. 

Scrap does play a vital role in reducing the demand on raw materials and energy. As per world steel one ton of scrap steel that is recycled can reduce the emission of CO2 by 1.5 tons and reduce coal consumption by 740 kg. 

The optimistic view is as global steel capacity jumped in the 2000s and life span of steel structures is 30-40 years, a fair amount of scrap steel should become available over the next decade or so which should be a net positive for the industry.  

Breakthrough Technologies 

Breakthrough technologies are not commercially available or feasible today. They are mostly in pilot stages waiting to be commercialised. The coming decade should demonstrate greater interest and investment flowing into these technologies, failing which net zero ambitions for the world at large would become challenging. The breakthrough technologies can be divided into two main categories. 

A. Using fossil fuel or bio fuels as a reducing agent but using carbon capture techniques (CCUS) to capture the CO2 emitted. Under the IEA's Sustainable Development Scenario by 2070, 75% of CO2 produced will be captured and stored. This requires a massive scale up of this technology from current levels. CCUS could potentially be retrofitted to all types of steel making units. Transportation & storage of CO2 though over distances becomes a huge challenge with CCUS. There is also the potential for cost increases from using CCUS facilities in steel manufacture and costs can rise by more than 10% and more. This would make many plants unviable without supportive policies. 

The world's first commercially viable CCUS steel facility is now underway at Emirates Steel. It captures 800,000 tons of CO2 which is captured, used and stored in underground oil fields in the Emirates. This is a DRI plant that uses natural gas CH4 to produce hydrogen and carbon monoxide as reducing agents. This results in CO2 being produced but instead of the CO2 being emitted into the atmosphere, it is captured at source. 

For more details of this project you can review the slide pack link, https://ieaghg.org/docs/General_Docs/9-11-15%20Presentations/P3_4_Abu%20Zahra.pdf 

B. Using hydrogen as a reducing agent which would result in water vapour being produced instead of CO2.   

In the DRI process, where fossil fuel such as natural gas or coal is used, iron ore gets reduced to iron but CO2 is generated in the process. If instead hydrogen is used as a reducing agent, then water vapour gets produced. Whilst H2 is being used in DRI, it is not used exclusively but in conjunction with carbon as a reducing agent. For a complete net zero emissions process, the endeavour would be to use green H2. Besides use in DRI, there are also plans to use H2 in BF as well as a blend. 

In future notes I shall write about CCUS and H2 applications for the industrial sector in general in more detail. 

Conclusions and path to net zero for steel

As per the IEA, in their Net Zero scenario, there is a steep fall in CO2 emissions from the steel industry. From a current rate of 2.4 billion tons pa to 1.8 billion tons by 2030 to 0.2 billion tons by 2050. This is despite production of steel remaining flat to slightly increasing over the same duration. The key reason for this sharp drop is the reduction in use of fossil fuel (although the use of fossil fuel / coal does not go to zero even in 2050).

The big shift / transformation is the move from coal to electricity as the EAF production method gathers considerable market share on the back of greater steel recycling. Electricity therefore plays a vital role in the industry and its share of energy source for the industry rises from 15% in 2020 to more than 70% by 2050. Electricity also is used in the production of H2 which is used in the DRI process as a potential low carbon / zero carbon option. 

Irrespective of the model or path for steel's decarbonisation, one thing stands out that there is no one single solution that will help decarbonise the entire steel sector. In summary, the following solutions will all have to be applied simultaneously to achieve a net zero position.

1. Energy efficiency to reduce the use of energy required per ton of steel produced 

2. Circular economy - recycling rates of steel is improved as energy requirements for converting recycled steel into steel is much lower than virgin steel

3. CCUS adoption - where fossil fuel is used as a reducing agent and CO2 is generated, CO2 can be captured and stored using CCUS technologies  

4. H2 - H2 can be used as a reducing agent in DRI processes to produce water vapour instead of CO2. H2 can also be used as a partial feedstock / injection in a blast furnace to reduce reliance on fossil fuel. 

5. Use of biofuels as a feedstock for energy. Whilst this produces CO2, the biofuel has been produced via an equal amount of absorption of CO2 from the atmosphere which then nets out. 

6. Greater electrification of the steel making process by relying more on EAF than BF/BOF and then also working towards a green power grid.    

7. Material efficiencies which includes better scoping of projects, using just the optimal amount of steel, building life extension and more modular design that uses less steel 

Additional links and resources 

Below are links to some of the innovations currently taking place in the steel industry. I have shared a few youtube videos that provide some additional context for the reader. 

A. HIsarna process: Tata Steel and others are engaged in this new development plan. This approach is aiming for ultra low CO2 steel where iron ore is reduced in just one step and very efficiently. This process does not need the use of coke as a reducing agent. 

https://www.youtube.com/watch?v=kdmjrO4sroA

B. SALCOS process: This process is aiming to use hydrogen (plus some % of natural gas) as a reducing agent and directly reducing iron ore to iron. This process is looking achieve 85% reduction of iron ore with around 50% drop in CO2 emissions.

https://www.youtube.com/watch?v=IPlwjg0G8yo

C. HYBRIT: a process being developed in Sweden to generate net zero steel. This is again a direct reduction process using H2 instead of coke as a reducing agent to produce pig iron from iron ore and then ultimately steel. 

https://www.youtube.com/watch?v=zk5-8DM0OvA

https://www.youtube.com/watch?v=GdR1lScN8HY [part 5 is the most interesting]

D. Hamburg / Arcelor Mittal - development of a H2 reducing pig iron, steel plant. The plant aims to only use H2 as a reducing agent to dramatically reduce CO2 emissions. Whilst it will use grey hydrogen as a start, it will move to green hydrogen when it is available.

https://www.youtube.com/watch?v=McJ8YHAaciI

Wednesday, December 22, 2021

Decarbonising The Industrial Sector - Part A

A lot of attention, focus and success in the last decade has been centred around decarbonising the power grid and developing electric vehicles. Admirable progress has been made in both these areas in a very short span of time and results are evident. The levelized cost of solar and wind generation has been falling dramatically and has now become very competitive vis-a-vis traditional fossil fuel generation assets. Likewise, EV's are fast becoming the vehicles of choice across many geographies and EV sales have held up whilst ICE vehicles faced considerable headwinds because of the pandemic. 

However, we have heard very little when it comes to carbonising the industrial sector. Is it because most green house gas (GHG) emissions occur in the power generation space or through tail pipe emissions? The answer is actually an emphatic no! 

As per most independent studies, the lion share of GHG emissions happens in the industrial sector, more precisely in the heavy industrial space. By heavy industries, I mean three core ones - Iron & Steel, Cement and Petrochemicals. 

Despite heavy industry being at the cornerstone of GHG emissions there is limited material out there that dwells on this problem. Through this note, I aim to share with you some key aspects of the heavy industrial sector so that you can take away these facts and form a more informed judgement on this very critical issue. 

A brief note of caution for the reader. I have shared sources in this note wherever possible; for any omissions I do apologise in advance. To determine the exact quantum of emissions is challenging for any analyst. This is a subject that is evolving and data analysis is subject to a lot of interpretation. My aim here is to share data from various sources but the overriding purpose of the note is not to focus on the precise number but to absorb and reflect on the magnitude of the problem at hand. 

Let's begin then. 

GHG Emissions by the Industrial Sector 

The annual GHG emissions (CO2, methane, nitrous oxide etc) from human activity including agriculture are estimated at 51 Giga tons (51 Billion tons). Whilst 2020 emissions fell due to COVID, we should work with this number as a start. Bill Gates in his book - How To Avoid A Climate Disaster references this number extensively. If I look at the site Our World In Data, total GHG emissions over the most recent years hovers around the 50 Giga ton mark. So for the purposes of this note, we shall stick to 51 Giga tons. 

We now need to drill a bit more into this 51 Giga ton number. What is it composed of and where do emissions come from? 

Based on Our World in Data, CO2 accounts for 75% of GHG emissions, methane is around 17%, nitrous oxide is about 6% and the balance is other gases. So CO2 forms the bulk of GHG emissions but it is not the only gas that causes this issue. Additionally, each of these gasses has very different properties with respect to heat transmission and absorption but this is not the focus of this note [There is extensive literature out there on this topic hence I shall not dwell upon it in this note].

Coming to the second question, where do these emissions come from? About 73% of the emissions arise from the use of energy (burning fossil fuel to produce energy), around 20% arise from agriculture and land use and the balance from process emissions and waste.   


Drilling down further demonstrates around 24% of the total emissions takes place on account of energy usage in industry. Additionally, around 5% of emissions take place because of process related emissions arising out of industrial manufacturing processes itself. The combined effect is staggering and clearly demonstrates that the industrial sector is the chief emitter of GHG emissions and must be studied in greater detail.   

The Industrial Sector 

The industrial sector is very broad and encompasses many industries that manufactures diverse products including many intermediary products. A broad classification of the industrial sector could include (a) ferrous metals (iron & steel), (b) non - metallic (cement, lime) (c) aluminium (d) petrochemicals and polymers (e) pulp, paper, forestry (f) food, tobacco etc (g) glass, silicates (h) others. 

For the purposes of this note we shall focus on the three heavy industries namely:

  • Iron & Steel
  • Cement 
  • Petrochemicals and polymers 
These three industries generate the bulk of GHG emissions within the industrial space and focussing on them is an excellent way to understand the challenges but also potential decarbonisation solutions. 

During subsequent notes, I shall go into each of these three heavy industries in greater detail. For this note I will share a few interesting facts about each of them before getting into the main body of the note which is why these industries are challenging to decarbonise. 

Iron & Steel: Firstly, 1 ton of steel production generates around 1.4 - 2 tons of CO2 (this is based on the most widely used steel manufacturing technique namely the blast furnace / basic oxygen furnace; there are many other techniques to produce steel). 

Total world crude steel production in 2020 was 1.8 B tons with China producing over 1 B tons and India coming next at around 100 million tons. To put things in better perspective, in the year 2000, global crude steel production was 850 million tons meaning that steel production has more than doubled in the last 20 years! 

Estimates of direct CO2 emission for the Iron & Steel industry centre around 2.6 G tons per annum. If indirect emissions are considered then the estimate is around 3.6 Gt. Steel making is highly energy intensive consuming more than 25 exajoules of energy or around 7%-8% of total global energy consumption which ties in with the fact that steel making is a high CO2 emissions industry. 

Cement: Production of 1 ton of cement generates around 0.5/0.6 tons of CO2 which makes it another high CO2 emitting industry. Basis the IEA, the industry emitted around 2.4 G tons of emissions in 2019; a staggeringly high number for a single industry. Cement production is also highly energy intensive with 3 GJ of energy being used to produce one ton of cement. Basis some independent estimates, the total energy consumption of the cement industry is around 15 exajoules per annum. 

World cement production in 2020 touched around 4.1 billion tons and has been around the 4 billion ton mark for nearly a decade now. In the year 2000, global cement production was just slightly north of 1.5 billion tons which demonstrates that production has nearly tripled over the last two decades! China produces around 2.2 billion tons of cement making it by far the largest cement producing country in the world. 

Petrochemicals and Polymers: The petrochemicals & associated industries are the largest energy consumers in the world with estimates of energy consumption per annum touching nearly 50 exajoules. Bulk of the energy consumption in this industry comes from fossil fuel. However, emissions are not as high as one would expect given the massive fossil fuel energy consumption. This is due to the fact that carbon from fossil fuel forms an integral part of the finished product. 

Worldwide plastic demand is the fastest growing bulk / heavy industry product outpacing global GDP growth, cement or steel. Production center for petrochemicals, polymers etc is the Asia Pacific region with around 50% of the global output and China dominates production capacity within the AsiaPac region. 

This sector is immensely diverse & challenging, the end products are multiple, many processes and approaches all leading to massive challenges around decarbonising the industry. 

I shall be writing individual notes on all the above three sectors in a bit more detail. The purpose of introducing these three industries here was to give the reader a flavour of these three industries which form the bulk of GHG emissions in the industrial sector. 

Now we come to the main point of the note. Why is it hard to decarbonise the industrial sector? Why is the industrial sector associated with the term 'hard to abate'? 

I did argue at the start of this note that much of the media and discussions steer towards decarbonisation of the power grid and cleaner electric vehicles whilst the industrial sector has languished in terms of coverage.  Let us focus in greater detail on what the specific challenges are hence why scant attention has been paid to this segment.

A. High temperature requirements:  Industry in general and heavy industry in particular needs high temperatures for many of its processes. In many cases temperatures needed are in excess of 1,000 celcius. Blast furnaces, petrochemical complexes all operate at very high temperatures and this high temperature generation at the moment can only be achieved via fossil fuel combustion. Combustion of fossil fuel is a near automatic cause of the GHG emission. At such high temperatures, electrification as a means to generate heat is not viable alternative and hence the industry sticks to fossil fuel combustion.  

B. Process emissions: The cement industry is an excellent case in point. The chemical process used to produce clinker which is ultimately used in the production of cement itself emits CO2. What this means is emitting CO2 is a must to produce the final product. In a separate note around cement (to be published in due course) we can get into more details but this is a key and fundamental issue why CO2 emission is hard to abate. The petrochemicals sector on the other hand uses some of the carbon from fossil fuel in the final product hence CO2 emissions from this sector are not as high as one would imagine given it consumes an incredible amount of fossil fuel. 

C. Industry characteristics: Heavy industry in particular is characterised by large capex, low margins, cyclicality and low R&D spend. Compared to the life sciences or technology industry, heavy industries like iron & steel spend very little on R&D. Process improvements have been slow and marginal over time. Further, as the margins are slim and the industry very cyclical, it prevents large financial resources being spent on optimising the process or reducing emissions. The ability to develop a completely radically new approach is very challenging. 

D. Highly traded nature of products: This applies to the iron & steel and petrochemicals industry. Cement is not a highly traded product and consumption generally takes place where it is produced. As the end products are highly traded, with slim margins and little product differentiation, it comes down to price as the key determinant. When price becomes the key determining factor, there is little incentive for the producer to spend large amounts of money on anything other than reducing the cost of production. Another related issue is whilst emissions are occurring in one country, consumption of the finished goods may be taking place in another country and this massively complicates issues. Border adjustment tax is one recent legislation being discussed in Europe to adjust for this problem. 

E. Integral nature of end products: the end products produced by heavy industry have now become integral to our living. For developing nations, the demand for steel and concrete is directly to developmental growth and infrastructure build out. Plastic consumption is rising across the board and is at a faster growth rate than global GDP growth rates. Whilst COVID may have temporarily blunted the growth in some sectors, it is back to near normal again in most. Product substitution is very challenging, for example no zero carbon substitute for steel exists today at any comparative cost. Even within the developed world where building & infrastructure activity is not as frenzied as developing countries, demand has not cratered and come to zero. 

Further, for many of the low carbon solutions in other sectors such as power generation, the requirement of steel & concrete is fundamental as shown in the graph below. 


F. Age of assets: Unlike the consumer goods or the high tech world where asset life is just a few years, steel mills, cement plants are long life assets (hardly anyone refurbishes a smart phone). Most heavy industrial assets have an asset life of 30-40 years and at some point in their mid life they are refurbished to extend the asset life. Hence, any decisions taken today to either build a new plant or to extend its life will have an impact many decades from now. The ability to set up entirely new plants with new processes is extremely challenging and not a viable solution. Retrofitting and making modular adjustments or trying to amend the fuel mix are therefore some potential solutions. In subsequent notes we shall touch these solutions in greater detail.  

As mentioned earlier in this note, China is a key player in the heavy industry space and has around 40%-60% of global manufacturing capacity in most of these sectors. The graph below from IEA shows the age of iron & steel and cement plants in China. Blast furnaces on average are 12 years old and cement kilns are 13 years old on average compared to their useful life of 40 years. These are therefore very new assets and have many years to go before they can be retired and this underscores my point that simply replacing assets is not a viable solution. 


In the next note, we shall look at the Iron & Steel sector in a lot more detail. In that note we shall review the main processes to produce iron & steel, how demand has grown, where its produced, the key challenges around CO2 emissions, some of the potential solutions the industry is looking at and how the next decade will shape up for this industry. 

Subsequent notes will cover cement, petrochemicals, hydrogen and carbon capture techniques. I hope that after reading all the notes, you will appreciate the challenges of decarbonising the entire global economy and pay much greater attention to government policies and technological developments in the heavy industry space.